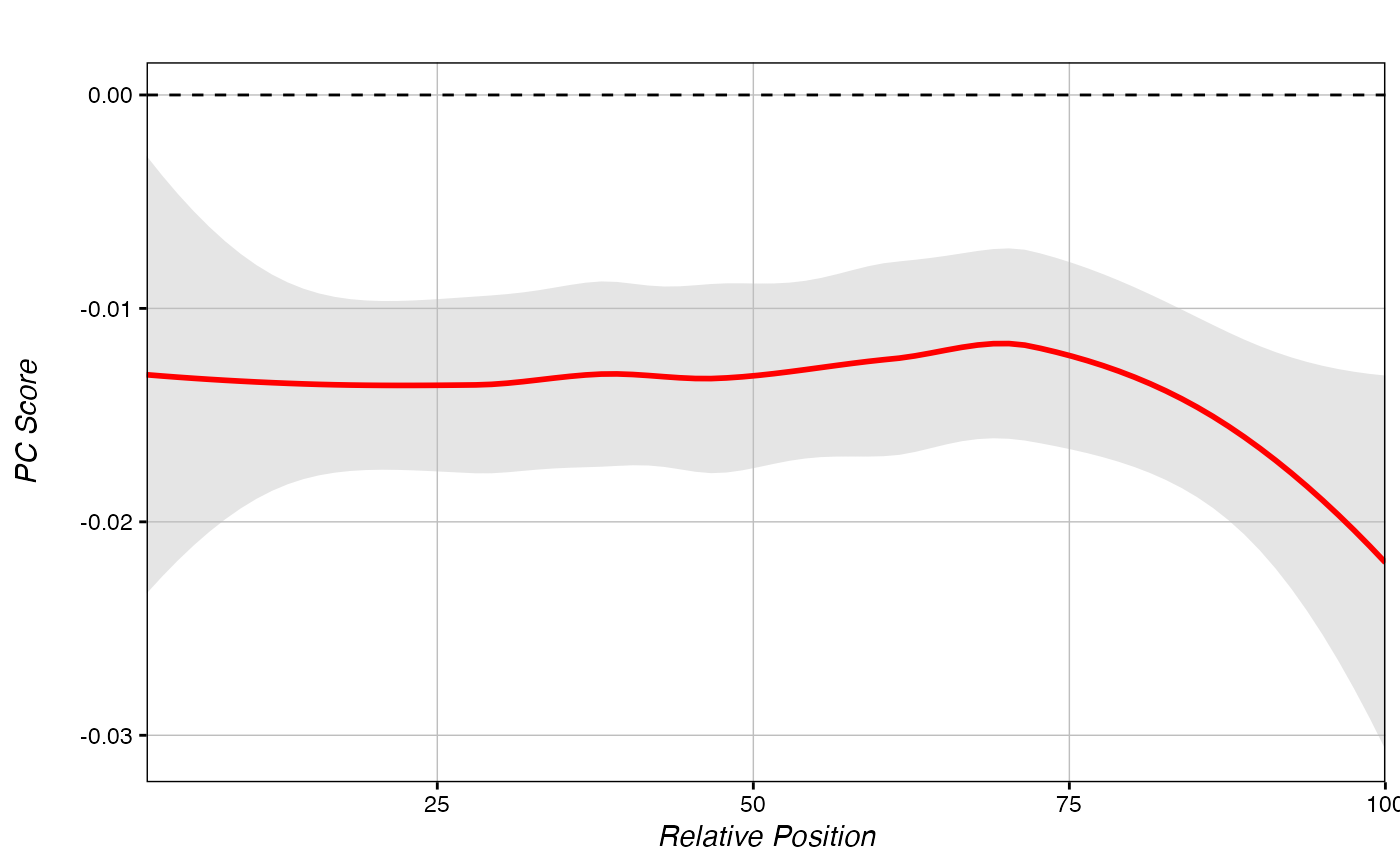
Generate a metagene plot from raw metagene data.
plot_metagene.RdPlots a metagene object using the raw data generated by score_metagene().
plot_metagene(data, title, xaxis, yaxis, linecol)Arguments
- data
list, score_metagene() raw data output
- title
Output plot title
- xaxis
Output plot x-axis title
- yaxis
Output plot y-axis title
- linecol
Colour for line, auto="red"
Value
Returns a grob containing a plot of the input metagene data.
Examples
ranks <- getPCRanks(eigen, IDs = c("trt", "ctl"), PC = 1)
DMRs <- Get_Novel_DMRs(ranks, 2940, minCpGs=10)
#> Splitting data by chromosome...
#> Bootstrapping background distributions for each chromosome...
#> Compressing nearby seeds...
#> done! Collapsed 2940 seeds to 250 seeds!
#>
#> Expanding DMRs from 250 seeds...
#> Trimming 135 DMRs...
#> done!

# Select all significantly hypomethylated DMRs:
hypo_DMRs <- DMRs[DMRs$FDR <= 0.05 & DMRs$DMR_Zscore < 0,]

# select chrom, start, and end of all hyper DMRs
regions_hypo <- hypo_DMRs[c(1:3)]

# return.data = T returns raw data instead of a plot:
hypo_metagene <- score_metagene(ranks, regions_hypo, return.data = TRUE)
#> Creating chromDict Object. If you plant to run the score_metagene() function multiple times, it is strongly recommended to generate a chromDict Object with the chromDict() function, and specify it with score_metagene(..., chromDictObj=OBJECT). This is the most computationally intensive part of metagene creation, and only needs to be done once.

plot_metagene(hypo_metagene)